
AGILE MARKETING EDUCATION – DECISIONS BASED ON DATA
Agile Marketing Case Content
Agile Significance Case Learning Objectives
The Learning Objectives of this Agile Marketing Education Case have been specifically selected and designed (as Agile Educators we apply and use Bloom’s Taxonomy) to help your Marketing Students:
- Understand by classifying Statistical Significance results in order to Determine the Validity of a Marketing Activity.
- Analyse by differentiating Performance levels of a Call to Action based on Statistical Significance Data in order to enhance Decision Making for Marketing.
Prior Learning:
As you apply Agile Marketing Education you will want to ensure you tap into and build from prior learning concepts such as Statistics to provide your Students with the best Marketing Outcomes. Help Marketing Students by Getting them to Think in terms of the Pillars of Empiricism (evidence discovered in experiments and validated measurement).
GETTING STARTED – APPLYING AGILITY IN MARKETING EXPERIMENTS
Provide Marketing Learners with a Quick example of Major Discoveries that occurred as a result of Experimentation.
These Pillars are often present during Experiments:
- TRANSPARENCY
- INSPECTION
- ADAPTATION
Challenges in Learning about Statistical Significance for Marketing:
Practicians of Agile Marketing are encouraged to engage in many small experiments over a few large bets (Reminder: this is one of the Agile Marketing Manifesto Values).
Challenges Marketing Learners face is with regards to conducting many small experiments without knowing how to apply Statistical Hypothesis Testing.
This is an area where an Agile Marketing Educator can contribute significantly on the Learner’s Marketing Experimentation Success rate and Insightful Tests by sharing practical theory and reliable Steps to ensure Marketers conduct Valid Experiments.
HYPOTHESIS TESTING STEPS
As stated above, conducting many experiments is highly valued in Agile Marketing but how can you help a Learner continuously Conduct Valid Experiments?
You may use any method you wish to conduct an A/B Test so long as it follows a Process guided by genuine Hypothesis Testing. However, for this Case we suggest the following Mnemonic-inspired Test alternative to ensure Students remember the Key Test Phases as it clearly spells out the word HOME:
- H – Hypothesis that can be tested based on observable Data
- O – Outcome that objectively suggests Success or Failure
- M – Marketing Activity Application
- E – Ensuring Statistical Significance of Observed Results
CALL TO ACTION CASE
During an Agile Stand-Up Meeting colleagues from Consumer Behaviour suggested that Product Attributes such as Fast Delivery are very powerful. The Social Media Department also indicated they received two positive Comments (out of 100) regarding Fast Delivery on Facebook. Analytics and Web Design people in the Company are more than happy to change your Call to Action in order to emphasize Fast Delivery.
Based on the above information, you decide to run an A/B Test using two nearly identical Pages on your company website but with different Call to Action.
How will you know if the results of your Test is Valid and legitimately merit to influence Changes on your Website and your Marketing Content?
TEST YOUR MARKETING HYPOTHESIS WITH HOME
H – Hypothesis
We will Test if “Fast Delivery” as a Call to Action will yield better Clickthrough Rates
O – Outcome
We will observe response between Call to Action and consider one as Better only if there is clear evidence from the Data gathered for CTA, CTR as well as Statistical Significance between the two samples.
M – Marketing Application
Create two Pages with Different Call to Action, let generic traffic run for 7 Days
E – Ensuring Statistical Significance
We will use a Statistical Significance Calculator for A/B Testing in order to analyse the two samples
THE CASE of TWO CTAs
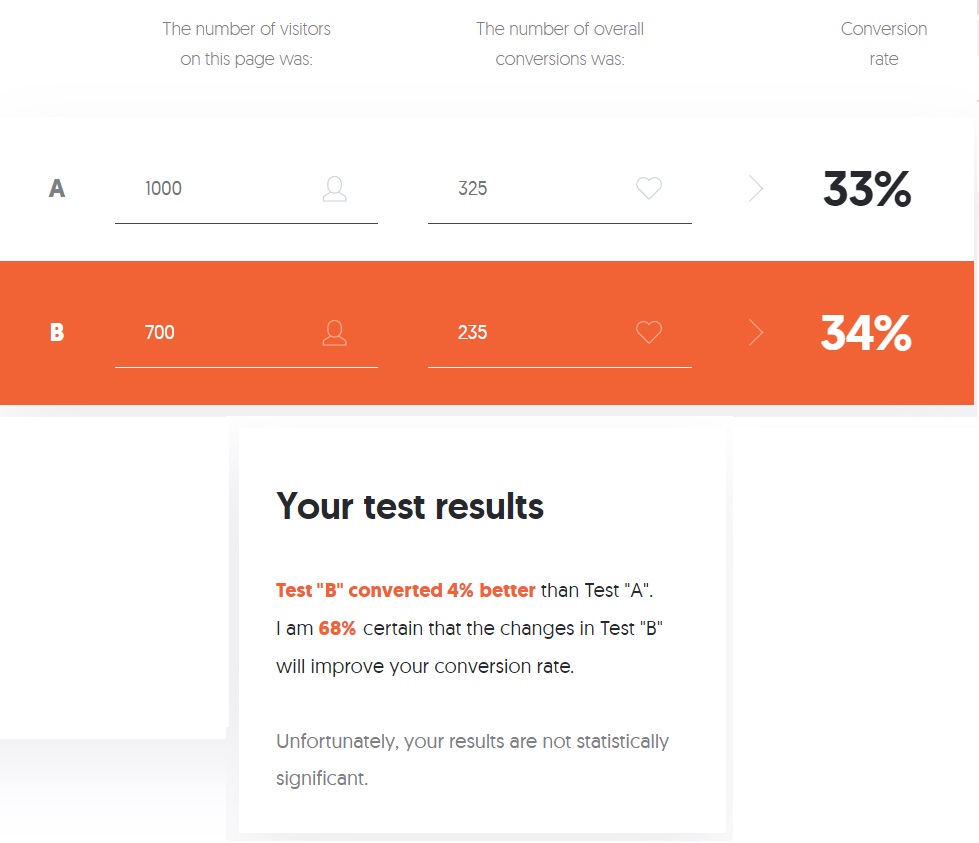
As an Agile Marketer pondering the Results of an A/B Test, you find that the Clickthrough Rate (CTR) for one Call to Action (CTA) is 34% versus another at 33%, should you automatically conclude that the 34% is statistically better and will you Direct Marketing Activities based on that Observation alone?
Results of the Test also revealed that each Page did not get equal Traffic (observed 700 Visits on one page while the other Page received 1000), could there be another Variable that influenced the Performance and can we still Test Significance?
Clickthrough Rate (CTR) for “Fast Delivery” was better by 1%.
CTA CASE DATA
TEST +1% CTR RESULTS ARE INVALID
CTA1
Visits:1000
CTA Clicks: 325
CTA CTR: 33%
CTA2 (“Fast Delivery”)
Visits:700
CTA Clicks: 235
CTA CTR: 34%
At first glance, CTA2 (“Fast Delivery”) appears to perform 4% better than CTA1 with an Overall CTR of 34%. Since 34% is better than 33%, we therefore should choose CTA2 and redesign our website, right?
How do you determine if the CTA had a real Impact?
AGILE EDUCATION TIP FOR DETERMINING STATISTICAL SIGNIFICANCE
Use an A/B Test Calculator Online in order to correctly interpret CTR and improve Decisions based on Statistical Significance.
1) Take a Moment to go Online and Select an A/B Test Calculator
2) Input the Visits and CTA Clicks for both Samples
3) Show the Certainty Calculation Results to the Students directly from the screen
Results of CTA2 VS CTA1 Certainty Calculation: 68%
Consider what it means when Statistical Significance is 68%, how certain are we that CTA2 is better than CTA1? What would you do?
GROUP DISCUSSION
As an Agile Marketer do you Test Further or simply make your final Marketing Decision based on the 68% Certainty you observed in the Case above?
Duration: 5 Minutes
BEYOND THE CONTROVERSY OF STATISTICAL SIGNIFICANCE IN MARKETING
Statistical Significance in Marketing can be controversial, some proponents of Opportunity Cost in Marketing (i.e. if Marketing waits for 90% Certainty, it makes us slow therefore we may lose Time and Opportunities) suggest that a Minimum Certainty can be established below 90% perhaps even near 70% is sufficient.
Although it may be tempting to discuss the issue solely with Marketing Management and establish your own Marketing threshold, don’t forget the Client.
The best course of action with regards to Marketing KPI level to use is to ask that Performance Question Differently – always embrace the perspective of the Client or even better, ask the them directly!
Consider the following Agile Marketing Value “Customer focused collaboration over silos and hierarchy”.
A Quick Way, and often effective way, of deciding if a Certainty of 68% is adequate would be to honestly determine if we would be comfortable revealing to a Marketing Client that we could be wrong 32% of the time.
AGILE MARKETING CASE RECAP
Hypothesis Testing is a simple way to help make Marketing Decisions.
It takes a few seconds to check and confirm Statistical Significance using an A/B Test Calculator Online!
Never forget the Client’s role in guiding your Marketing Decisions.
Are you a Marketing Educator?
Do you have Comments, Advice or Experiences to Share with regards to how you Teach Decision Making in Marketing? Contact Us!